








|
Marché Fermé -
Nasdaq Stockholm
18:00:00 23/10/2026
|
Varia. 5j. | Varia. 1 janv. | ||
| 6,620 SEK | -0,30 % |
|
0,00 % | +27,80 % |
| 25/09 | Un administrateur achète 54 761 actions de Pion Group | FW |
| 19/08 | PION Group AB (publ) publie ses résultats pour le deuxième trimestre et le premier semestre clos le 30 juin 2026 | CI |
Description de l'Activité: PION Group AB

Nombre d'employés: 2 521
Répartition des Ventes par Activité: PION Group AB
| Période Fiscale: Décembre | 2021 (SEK) | 2022 (SEK) | 2023 (SEK) | 2024 (SEK) | 2025 (SEK) |
|---|---|---|---|---|---|
Uniflex | 1,08 Md | 1,21 Md | 1,09 Md | 837 M | 771 M |
QRIOS | - | 237 M | 242 M | 215 M | 169 M |
Uniflex Finland | 30,42 M | - | - | - | - |
Eliminations | - | -42,9 M | - | - | - |
Poolia | 588 M | 640 M | 690 M | 549 M | 473 M |
Norway | 83,36 M | - | - | - | - |
Poolia Finland | 51,19 M | - | - | - | - |
Germany | 71,1 M | 42,9 M | - | - | - |
Répartition Géographique des Ventes: PION Group AB
| Période Fiscale: Décembre | 2021 (SEK) | 2022 (SEK) | 2023 (SEK) | 2024 (SEK) | 2025 (SEK) |
|---|---|---|---|---|---|
Sweden | - | - | - | 1,48 Md | 1,32 Md |
Finland | - | - | - | 70,05 M | 50,46 M |
Norway | - | - | - | 54,67 M | 43,1 M |
Denmark | - | - | - | 621 k | 1,79 M |
Comité Exécutif: PION Group AB
| Dirigeant | Titre | Age | Depuis |
|---|---|---|---|
Martin Hansson
CEO | Directeur Général | 58 | 08/05/2024 |
| Directeur Financier/CFO | 58 | 31/07/2025 | |
Mats Kullenberg
CEO | Directeur Général | 62 | 15/03/2023 |
Elin Strandberg
HRO | Responsable des Ressources Humaines | 45 | 01/01/2010 |
Composition du Conseil d'Administration: PION Group AB
| Administrateur | Titre | Age | Depuis |
|---|---|---|---|
Martin Hansson
BRD | Directeur/Membre du Conseil | 58 | 12/10/2020 |
Lars Henrik Kry
CHM | Président | 57 | 12/10/2020 |
| Directeur/Membre du Conseil | 64 | 27/04/2021 | |
| Directeur/Membre du Conseil | 58 | 01/01/2023 |
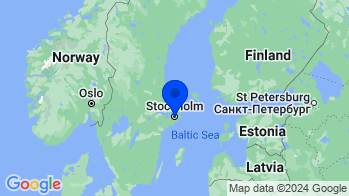
Coordonnées de la Société: PION Group AB
Services pour l'emploi - Autres
Ajouter à une liste 0 sélectionné | Varia. | Varia. 5j. | Varia. 1an | Varia. 3ans | Capi.($) | |
|---|---|---|---|---|---|---|
 | -0,30 % | 0,00 % | +15,33 % | +10,33 % | 32,25 M | |
| -0,60 % | +3,70 % | +142,15 % | +323,74 % | 170 Md | |
| -1,23 % | +5,28 % | +8,03 % | +26,12 % | 117 Md | |
| -0,65 % | +5,74 % | -5,38 % | +1,21 % | 40,05 Md | |
| +1,43 % | +18,78 % | +19,13 % | -13,49 % | 7,99 Md | |
| +0,30 % | -1,67 % | -25,76 % | +13,83 % | 7,33 Md | |
| +0,34 % | +6,50 % | +76,38 % | +249,11 % | 4,98 Md | |
| +1,68 % | +9,32 % | +3,60 % | -31,95 % | 4,76 Md | |
| -0,34 % | +3,56 % | +13,40 % | +37,29 % | 4,23 Md | |
| +2,55 % | +7,22 % | +10,28 % | +71,04 % | 4,17 Md | |
| Moyenne | +0,22 % | +5,92 % | +25,72 % | +68,72 % | 36 Md | |
| Moyenne pondérée par Capi. | -0,66 % | +6,03 % | +70,33 % | +165,55 % |
Secteur

Bénéfices annuels - Taux de surprise


- Bourse
- Actions
- Action PION B
- Société PION Group AB
Sélectionnez votre édition
Toutes les informations financières adaptées au niveau national


