








Description de l'Activité: Darktrace plc

La répartition géographique du CA est la suivante : Royaume Uni (15,2%), Europe (24,9%) Etats-Unis (34,6%) et autres (25,3%).
Nombre d'employés: 2 543
Répartition des Ventes par Activité: Darktrace plc
| Période Fiscale: Juin | 2020 (USD) | 2021 (USD) | 2022 (USD) | 2023 (USD) | 2024 (USD) |
|---|---|---|---|---|---|
Development and Sale of Cyber-Threat Defence Technology | 199 M | 281 M | 415 M | 545 M | 691 M |
Répartition Géographique des Ventes: Darktrace plc
| Période Fiscale: Juin | 2020 (USD) | 2021 (USD) | 2022 (USD) | 2023 (USD) | 2024 (USD) |
|---|---|---|---|---|---|
USA | - | - | 143 M | 189 M | 241 M |
Europe | 37,94 M | 61,92 M | 100 M | 136 M | 182 M |
Rest of World | 41,65 M | 59,63 M | 103 M | 138 M | 173 M |
United Kingdom | 38,27 M | 50,43 M | 69,23 M | 82,84 M | 94,73 M |
USA and Canada | 81,21 M | 109 M | - | - | - |
Comité Exécutif: Darktrace plc
| Dirigeant | Titre | Age | Depuis |
|---|---|---|---|
Edward Jennings
CEO | Directeur Général | 56 | 23/03/2026 |
John Allen
CMP | Compliance Officer | - | - |
Mike Beck
CTO | Directeur Technique/Scientifique/R&D | - | 01/07/2020 |
Luk Janssens
IRC | Investor Relations Contact | - | 01/09/2020 |
David Smith
HRO | Responsable des Ressources Humaines | - | 15/04/2024 |
Composition du Conseil d'Administration: Darktrace plc
| Administrateur | Titre | Age | Depuis |
|---|---|---|---|
Stephen Shanley
BRD | Directeur/Membre du Conseil | 40 | 01/04/2021 |
Johannes Sikkens
BRD | Directeur/Membre du Conseil | 48 | 01/04/2021 |
David Willetts
BRD | Directeur/Membre du Conseil | 70 | 01/04/2021 |
Peter Bonfield
BRD | Directeur/Membre du Conseil | 82 | 01/04/2021 |
Paula Hansen
BRD | Directeur/Membre du Conseil | 53 | 01/01/2024 |
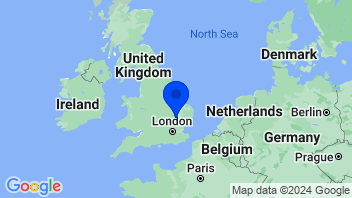
Coordonnées de la Société: Darktrace plc
Logiciels de sécurité
Ajouter à une liste 0 sélectionné | Varia. | Varia. 5j. | Varia. 1an | Varia. 3ans | Capi.($) | |
|---|---|---|---|---|---|---|
 | +0,66 % | -2,77 % | +0,76 % | +60,56 % | 3 870 Md | |
| +0,29 % | -1,87 % | +12,11 % | +1 121,29 % | 471 Md | |
| +0,49 % | -6,18 % | -53,73 % | +23,87 % | 381 Md | |
| +7,22 % | +2,78 % | +79,15 % | +213,08 % | 284 Md | |
| -0,44 % | +6,53 % | -9,48 % | +73,01 % | 278 Md | |
| +8,25 % | +5,32 % | +106,01 % | +476,35 % | 244 Md | |
| +1,25 % | +6,99 % | -15,05 % | +46,50 % | 162 Md | |
| +4,05 % | -1,06 % | +112,60 % | +219,36 % | 128 Md | |
| -2,49 % | +4,83 % | -25,49 % | -51,23 % | 105 Md | |
| Moyenne | +2,22 % | -0,42 % | +22,99 % | +242,53 % | 658,2 Md | |
| Moyenne pondérée par Capi. | +0,97 % | -2,62 % | +7,29 % | +168,71 % |


