Limite quotidienne gratuite atteinte. Pour continuer votre navigation ABONNEZ-VOUS !
Plus de 1'000'000 d'investisseurs nous ont déjà rejoints. Comme eux, Répliquez nos Performances ou Identifiez Facilement les Meilleurs Investissements de Demain grâce à nos Outils, Conseils et Analyses d'Experts
Mensuel
Annuel
-20%
Access
Informations et données pour investisseurs autonomes exigeants
Access
-17%
24
29€€/mois
24
29€€/mois
Informations et données pour investisseurs autonomes exigeants
Des portefeuilles réels à répliquer (Europe, USA, ASIE)
Accédez aux décisions concrètes d’investissement qui nous ont fait connaître.
Suivez en totale transparence nos positions et la performance de nos trois portefeuilles bel et bien gérés sur les marchés : Europe, USA, Asie. Nos performances sont réelles, nettes de frais de courtage et de taxes sur les transactions.
Nos portefeuilles sont composés de sociétés liquides.
Les valeurs sont ventilées par pays/secteurs pour réduire le risque.
Vous êtes alerté pour chacune de nos opérations exécutées.
En moyenne deux opérations par mois et par portefeuille.
Nous n’effectuons pas d’opérations de « market timing ».
*Les performances passées ne préjugent pas des performances futures.
Une base de données mondiale sans équivalent
Notre base de données est la référence des investisseurs exigeants. Alimentée par les meilleures sources, elle couvre tous les marchés et tous les instruments cotés. Pour suivre votre portefeuille, un secteur ou que vous cherchiez de nouvelles opportunités, notre plateforme vous offre une vision exhaustive en un seul endroit.
Media de référence et profondeur d’information inégalée
Zonebourse est le média de référence pour suivre les marchés financiers. Profitez de notre indépendance et de notre expertise avec une vue globale et à 360 degrés : actions, ETFs, secteurs, économie, indices, devises, cryptomonnaies, matières premières…
Utilisée par des millions d’investisseurs chaque mois dans plus de 90 pays, notre offre d’informations est reconnue mondialement pour sa robustesse, sa réactivité, sa couverture et sa valeur ajoutée.
Prenez de la hauteur avec nos articles, analyses et décryptages rédigés par notre équipe de journalistes, d’analystes et de scientifiques, experts des marchés financiers.
Suivez les marchés en temps réel grâce à des flux d'informations issus des meilleures sources mondiales, disponibles dans sept langues et traduits automatiquement pour une lecture immédiate.
Disposez de la base documentaire la plus exhaustive disponible en ligne. Accédez à une richesse et une profondeur d’information sans équivalent pour suivre vos valeurs, vos secteurs ou dénichez des sociétés spécifiques.
Accédez au travail de synthèse de nos journalistes qui se lèvent tôt et se couchent tard pour vous tenir fidèlement informés et vous faire gagner du temps.
Les experts Zonebourse produisent des analyses et de conseils quotidiennement. Vous pouvez ainsi découvrir ou redécouvrir des sociétés dans lesquelles investir ou à éviter.
Rédigés par notre équipe d’experts, nos articles de fond vous aideront à prendre vos décisions et à comprendre les nôtres.
Nous sélectionnons des sociétés de qualité, c'est-à-dire des entreprises qui se développent, gagnent de l'argent sans faire appel outre mesure à l'endettement et aux niveaux de valorisation raisonnables au regard de leurs avantages. Le temps joue en leur faveur.
Nous suivons en permanence 70 thèmes d’investissement qui font la une de l’actualité ou qui correspondent à des tendances de fond.
Retrouvez nos listes de valeurs sous forme de portefeuilles avec leur performance, leur exposition sectorielle et géographique. Chaque thème est expliqué en détail, les listes de sociétés sont très régulièrement mises à jour.
Suivez vos valeurs ou importez vos informations pour piloter efficacement vos investissements grâce à nos outils, bases de données et actualités:
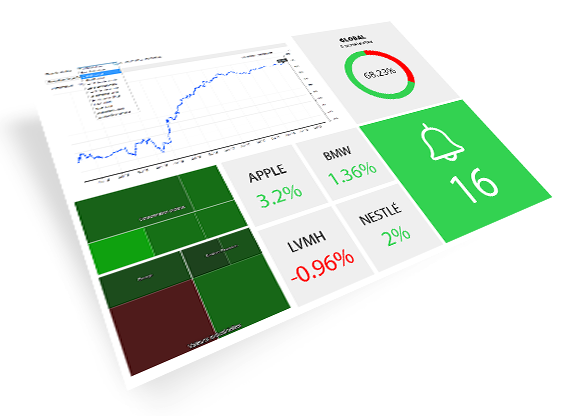
Créez jusqu’à 10 listes de 50 valeurs pour suivre vos sociétés favorites : cotations en temps réel, informations, publications de résultats, évolution des estimations, recommandations des brokers…
Paramétrez vos alertes pour ne rater aucune information.
Importez vos portefeuilles et comptes-titres grâce à notre outil, le Portfolio Manager, compatible avec plus de 400 banques et courtiers en ligne.
Comme les grands investisseurs et les analystes professionnels, allez au plus près des entreprises en accédant aux transcriptions des annonces de résultats, des conférences avec les investisseurs ou des présentations réalisées par l'entreprise.
Chaque transcription est structurée et organisée pour vous permettre de naviguer facilement entre les propos des dirigeants et les questions des analystes ou des investisseurs.
Retrouvez également une analyse de positivité du contenu ainsi qu'un classement des mots clés utilisés.
Toujours à jour et idéal pour l'analyse fondamentale et la génération d'idées. Pour un usage immédiat, pour un meeting ou dans le cadre d'un comité d'investissement, ils peuvent être imprimés, annotés, partagés et stockés.
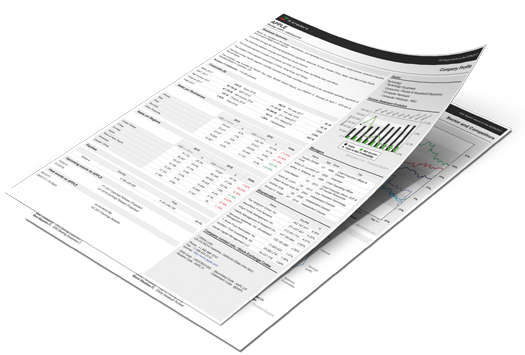
A télécharger et disponibles sur plus 60.000 sociétés cotées, les rapports synthétiques de 6 pages contiennent toutes les informations détaillées, ils offrent une vision complète de chaque société :
Qu'est-ce qui est inclus dans mon abonnement Access ?
L'abonnement Access est dédié aux investisseurs autonomes exigeants qui cherchent de l'information et des données.
Votre abonnement Access comprend de nombreux avantages, dont les suivants :
Une navigation illimitée sans blocage publicitaire, avec un accès complet sans limite à l'ensemble des actualités, articles et analyses Zonebourse.
L'accès gratuit aux newsletters quotidienne (Morning Meeting) et hebdomadaire (point hebdo).
La gratuité de tous nos guides payants que vous pouvez télécharger facilement depuis votre compte Zonebourse.
L'accès au Portfolio Manager.
Un service client pour vous aider et vous accompagner.
L'accès gratuit à l'application iPhone payante de Zonebourse.
L'accès à de nombreuses listes thématiques d'investissement, listes d'actions conçues spécialement pour chaque style de gestion ou d'investissement (valeurs: de croissance, décotées, à dividendes, de qualité, ESG, multibaggers, de stratégie offensive, dynamique, etc.)
L'accès à + de 50 listes d'actions classées selon leur secteur d'exposition ou un thème particulier (solaire, éolien, jeux vidéo et Esport, défense, hydrogène, internet, intelligence artificielle, robotique, e-commerce, fintechs, blockchain, métaux stratégiques ou rares, etc.)
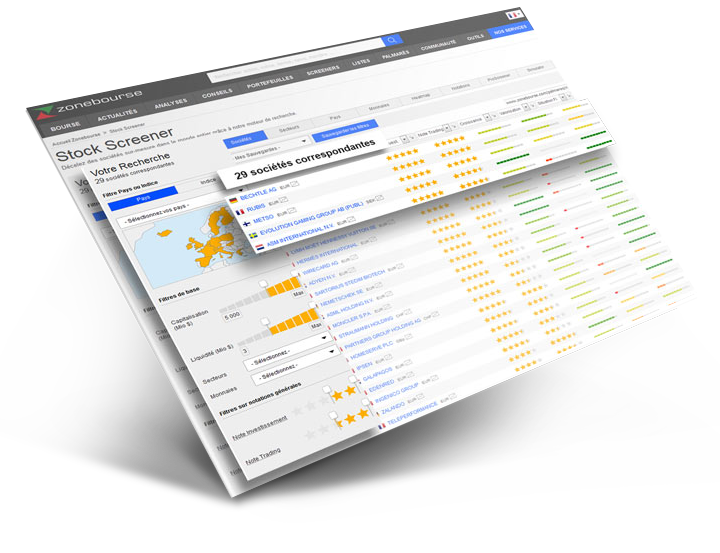
L'accès au Stock Screener le plus abouti du marché, vous pouvez classer et comparer toutes les sociétés
Scoring exclusif des entreprises (note investissement et note trading disponible via notre Stock Screener) construit selon de nombreux critères (croissance, valorisation, révision BNA long-terme, situation financière, rentabilité, publication et visibilité, révision BNA court-terme, etc.) permettant à nos clients de rapidement identifier celles que nous classons selon des investissements long ou court terme.
L'accès à la génération automatique de rapports financiers en PDF sur l'ensemble des sociétés cotées mondiales
Un accès étendu aux listes personnalisées (10 * 50 valeurs)
Un accès étendu aux portefeuilles virtuels (10 * 50 valeurs)
Accès à des centaines de métriques fondamentales
Données fondamentales de qualité institutionnelle, nous travaillons avec tous les fournisseurs de data financières et boursières les plus fiables et reconnus dans le monde (Refinitiv, S&P Global, MorningStar, Factset, etc.)
Qu'est-ce qui est inclus dans mon abonnement Premium ?
L'abonnement Premium est dédié aux investisseurs qui souhaitent suivre nos opinions et décisions pour les accompagner en bourse
Votre abonnement Premium comprend de nombreux avantages :
L'ensemble des outils, services et contenus de l'abonnement Access
L'accès illimité à tous les conseils de nos experts pour vous aider à optimiser la performance de vos investissements
L'accès aux 3 portefeuilles EU / US / Asie réellement investis pour suivre et répliquer nos investissements et vous aider à battre les marchés
L'accès illimité au Stock Screener le plus abouti du marché, vous pouvez classer et comparer toutes les sociétés
L'accès illimité à la génération automatique de rapports financiers en PDF sur l'ensemble des sociétés cotées mondiales
L'accès à la Newsletter Premium
Cette formule vous aidera à optimiser la performance de vos investissements et à battre les marchés.
Qu'est-ce qui est inclus dans mon abonnement Expert ?
L'abonnement Expert est dédié aux investisseurs qui recherchent des outils décisionnels pour experts de l'investissement
Votre abonnement Expert comprend de nombreux avantages :
L'ensemble des outils, services et contenus de l'abonnement Premium
Un accompagnement téléphonique personnalisé, en direct avec nos experts
L'accès au Stock Screener version Pro
L'accès à l'Event Screener
L'accès illimité à la génération automatique de rapports financiers en PDF sur l'ensemble des sociétés cotées mondiales ainsi que la possibilité de personnalisation de ces modèles de rapports financiers
Un accès étendu aux listes personnalisées (50 * 500 valeurs)
Un accès étendu aux portefeuilles virtuels (20 * 100 valeurs)
Cette formule vous aidera à atteindre de nouveaux sommets dans la performance de vos investissements et dans la maîtrise et la compréhension des marchés boursiers.
Qu'est ce qui justifie le prix de vos abonnements ?
Zonebourse offre précisément le meilleur rapport quantité, qualité prix.
D'autres sociétés peuvent proposer des abonnements moins chers, mais aucune ne propose un service aussi complet d'informations, d'outils, d'analyses, de conseils, de portefeuilles réellement investis, etc., que Zonebourse.
Zonebourse propose le service le plus complet pour investir en bourse.
Toute l'actualité boursière du monde en live
Contenus exclusifs Zonebourse à haute valeur ajoutée dont nos analyses et nos conseils d'investissement
Une base de données sans équivalent couvrant +99.9% des sociétés cotées du monde
Les Meilleurs outils boursiers d'analyses et de stock screening, offrant un panel complet pour investir en bourse
3 portefeuilles EU, US, Asie réellement investis pour vous permettre de répliquer nos investissements et nos niveaux de performance qui surperforment les marchés mondiaux
Formation pour vous aider à progresser et mieux comprendre les marchés
L'Application boursière la plus complète du marché
Zonebourse offre aux utilisateurs des données claires, conviviales, de qualité et approfondies afin que vous puissiez être plus performant que le marché et devenir le type d'investisseur que vous souhaitez être.
Comment faites-vous pour proposer autant d'outils et de contenu de qualité ?
Tous les investisseurs méritent de bénéficier d'informations de qualité basées sur des données fiables. Parce que nous existons depuis 2001, nous n'avons eu de cesse durant 20 ans de créer les outils dont nous avions besoin pour piloter, suivre, analyser les marchés et faire progresser nos portefeuilles.C'est pourquoi nos outils sont si utiles et performants car ils prennent naissance dans les besoins concrets de tous les investisseurs avisés.
Concernant la qualité de nos contenus nous avons constitué et fait grossir au fur et à mesure nos équipes d'analystes, de journalistes pour proposer quotidiennement à nos clients des contenus exclusifs et de haute qualité. Chez Zonebourse il n'y a pas un seul membre de l'équipe qui n'est pas expert dans son domaine.
Pourrai-je accéder à Zonebourse à partir de plusieurs plateformes ?
Oui. Vous pouvez accéder à zonebourse.com en passant par le site mobile et le site de bureau, ainsi qu'à l'application mobile iOS (gratuite à partir de la formule Access).
Avec un seul abonnement, peut-on accéder à toutes les éditions (FR, US, ES, etc.) ?
Chaque édition de nos produits est considérée comme un site à part entière, avec ses contenus exclusifs, des actualités adaptées, des mises en avant (cotations, marchés, etc.) adaptées à chaque édition. Néanmoins nous offrons à tous nos membres la possibilité d'accéder à l'ensemble de nos éditions en se connectant avec l'identifiant et le mot de passe de leur édition d'origine.
Accédez à l'offre d'information financière et boursière la plus complète du marché couvrant plus de 99.9% des sociétés cotées du monde.
Nos notations et nos systèmes d'analyses, techniques et fondamentaux, sont mis à jour quotidiennement sur près de 20 000 sociétés.
Nous couvrons aussi prés de 10 000 ETF et plus de 280 000 indices, et tous types de cotations (devises, crypto, matières premières, etc.).
Qui est votre fournisseur de données ?
Nous travaillons avec tous les fournisseurs de data financières et boursières les plus fiables et reconnus dans le monde tels que Refinitiv, S&P Global, MorningStar, FactSet, et bien d‘autres encore.
Que dois-je faire si j'ai des problèmes avec mon abonnement ?
Vous pouvez nous contacter à tout moment. Notre service client est disponible durant les horaires d'ouverture pour répondre à toutes vos questions. Il est constitué de vrais humains et d'experts pour vous accompagner dans l'utilisation de notre site afin d'optimiser la performance de vos investissements.
Que faire si je veux annuler mon service ?
Si vous souhaitez mettre fin à votre abonnement Zonebourse, vous pouvez le faire à tout moment, très facilement et rapidement via le bouton « résilier » disponible à partir de « mon compte » > "mes abonnements".
Quels modes de paiement acceptez-vous ?
Nous acceptons actuellement toute carte de crédit ou de débit du type MasterCard, Visa, American Express, Gpay, Apple pay. Nous acceptons également PayPal. Tous les paiements sont traités de manière sécurisée par Stripe ou Paypal.
Puis-je passer un ordre directement sur Zonebourse ? Puis-je ouvrir un compte sur Zonebourse ?
Passer des ordres n'est pas notre cœur de métier et nous laissons cette partie-là à nos partenaires, ou d'autres acteurs, courtiers, banques, logiciels de courtage, etc.
Néanmoins si vous recherchez des solutions de courtage, Zonebourse a négocié pour vous des tarifs et des avantages exclusifs sur les 3 meilleures plateformes de courtagehttps://www.zonebourse.com/services/offre-courtage/courtage_home/
Puis-je mettre des alertes sur le prix d'une action/ETF etc. ?
Cette fonctionnalité n'est pas disponible sur Zonebourse car elle correspond plus au cœur de métier de nos partenaires courtiers ou logiciel de trading, chez qui vous pourrez retrouver des fonctionnalités vous permettant de mettre des alertes sur les évolutions de valeurs de différentes cotations. Si vous souhaitez un outil vous permettant de configurer des alertes sur cotations, Zonebourse a négocié pour vous des tarifs et des avantages exclusifs sur les 3 meilleures plateformes de courtagehttps://www.zonebourse.com/services/offre-courtage/courtage_home/
Quel abonnement me donne accès aux transcripts ?
Zonebourse en tant que média spécialisé en actu boursière donne accès à de nombreux types de contenus divers et variés (articles, analyses, vidéos, formation, transcripts, etc). Avec un simple abonnement Access vous pouvez accéder à l'intégralité des transcripts disponibles sur notre site.
Les Transcripts, outil essentiel de l'investisseur avisé, vous permettront de compléter l'analyse en profondeur d'une société au-delà de ses comptes de résultats.
Si mon abonnement s'arrête, est-ce que je vais perdre mes données / listes / portefeuilles ?
En cas d'abonnement expiré vous perdez accès aux outils et services liés à votre formule d'abonnement. Néanmoins vos listes, portefeuilles, etc.ne sont pas supprimés et vous pouvez y accéder à nouveau à tout moment avec un abonnement actif.
Comment supprimer mon compte ?
Parce que le contrôle et la gestion de vos données personnelles est un principe central chez Zonebourse vous pouvez à tout moment et très simplement demander la suppression de votre compte en passant par notre formulaire de contact > données personnelles > supprimer mes données personnelles
Dans les plus brefs délais notre service client s'occupera de la suppression de votre compte et vous recevrez par email la confirmation de cette suppression.
Vous avez d'autres questions ?
Nous espérons que vous avez trouvé les réponses que vous cherchiez. S'il vous reste des questions veuillez contacter notre service client constitué de vrais humains, qui sont experts de la finance ou de leur domaine et qui auront à cœur de répondre qualitativement à toutes vos questions.
Ils parlent de nous
Avis d’utilisateurs
X
Xavier D. Ancien Trader
Pour un investisseur fondamental, Zonebourse est un outil surpuissant: un stock screener permettant de dénicher les plus belles valeurs, des données financières et des fiches valeurs très complètes. Le suivi des portefeuilles Zonebourse me donne des idées qui je peux (ou non) suivre, et les articles sont très documentés. Je ne pourrais plus m'en passer !
d
dirk diggle
J'ai eu une chance incroyable de découvrir Zone Bourse! Complètement néophyte j'ai beaucoup appris grâce à toutes les données et à une équipe formidable toujours disponible et à l'écoute. Je pense que c'est le meilleur site boursier (graphiques percutants, toutes les news, le stockscreener hyper puissants, différentes analyses techniques et onglets). Merci Jordan, Nicolas, Anthony, Xavier et toute l'équipe!!
O
Osterman
Le seul media financier qui permet de joindre des professionnels qui s'efforcent de rester disponibles. Mes pratiques pédagogiques ont pu évoluer grâce à l'accompagnement du service client et m'ont permis de renouveler mon approche des enseignements des marchés financiers. Le recours à un média transforme en profondeur la vision traditionnelle de la formation des professionnels du chiffre.
R
Raphaël G. Spécialiste Small Caps
Zone Bourse est devenue LA référence en France en matière d'informations et de pédagogie sur la Bourse et les marchés financiers en général. Un Bloomberg pour tous en somme !
S
Scheibling
Je suis bien sûr satisfaite du site que je consulte depuis les années 2000. Je pense que c'est le meilleur site boursier actuellement et depuis 2000, hyper bien fait (graphiques percutants toutes les news, les différentes analyses techniques et onglets) J'ai beaucoup apprécié votre aide au sujet des graphiques experts, vous avez pris le temps de m'expliquer comment paramétrer ces nouveaux graphiques ce dont je vous remercie vraiment.
C
CG
Site ultra complet, cotations realtime, news etc. Parfait pour suivre ses investissements.
V
Ville44
Site indispensable pour faire de bons choix !
M
Marie Lowyck
je trouve chez Zonebourse les informations financières dont j'ai besoin et j'aprécie les commentaires tous les matins de'Anthony Bondain et aussi le rapport du Fonds Europa One -
N
Nono
De bon conseils un bon suivi et des personnes disponibles et compétentes
G
GUELLE Philippe
Site sérieux et très documenté. Les graphes sont facilement paramétrables.
M
Marie Josée Nom VENDITTI
Depuis mon achat conseil be semiconductor je suis satisfaite , cette entreprise mérite d'être conseillée au long terme...Merci
d
derhy
Excellent site d informations boursière .De très nombreux outils d'aide a la décision. Des screeners personnalisable et très intuitifs . Fiche valeur compléte et analyse des sociétés secteurs. Je recommande vivement ce site qui est un incontournable.
B
Bouroulet
J'apprecie la richesse du contenu du site, le screener. Les autres fonctionnalites sont super. Pour le reste l'info est bien presentee je trouve et quand on cherche une info en general on la trouve.
H
Honegger
ZoneBourse est aujourd'hui un des sites les plus complet en terme de suivi des marchés boursiers. Il regorge d'informations boursière, les rapports pdf sur les titres sont très complets mais je mettrais plus en avant vos analyses techniques.
P
Plasse-Fauque
je suis effectivement tout à fait satisfait du site zone bourse, autant d'informations en un seul endroit! je pense que c'est unique, et fait gagner beaucoup de temps ce que j'apprécie.
G
Ginestet
J'apprécie la complétude des informations délivrées ; Les sessions de présentation en visio me sont bien utiles pour mieux cerner les outils ; Les avis donnés et positions prises par ZB sur les valeurs me semblent être transparents ;
J
Jean Pierre DENYS
Le site le plus large (peut-être) d'informations boursières. Un panel extrêmement étendu de sociétés analysées. Des screeners qui sont autant d'innovations remarquables d'efficacité. Un grand bravo.
M
Micama
C'est le seul site que j'ai trouvé qui est si complet. En cherchant un peu, on a tout ce que l'on cherche. Je suis juste un peu déçue cette année que vos portefeuilles investisseurs ne soient pas meilleurs... Personne n'a de boule de cristal, même les meilleurs!
Ils travaillent avec nous
Mensuel
Annuel
-20%
Access
Informations et données pour investisseurs autonomes exigeants
Access
-17%
24
29€€/mois
24
29€€/mois
Informations et données pour investisseurs autonomes exigeants