








|
Marché Fermé -
OTC Markets
15:29:27 29/10/2026
|
Varia. 5j. | Varia. 1 janv. | ||
| 0,000001 USD | -.--% |
|
-.--% | - |
Description de l'Activité: Choom Holdings Inc.

Nombre d'employés: 70
Répartition des Ventes par Activité: Choom Holdings Inc.
| Période Fiscale: Juin | 2019 (CAD) | 2020 (CAD) | 2021 (CAD) |
|---|---|---|---|
Retail Cannabis | - | 7,36 M | 22,05 M |
Patient Counseling with The Acquisition of The Medical Centre | 268 k | - | - |
Patient Counselling | - | 587 k | - |
Répartition Géographique des Ventes: Choom Holdings Inc.
| Période Fiscale: Juin | 2019 (CAD) | 2020 (CAD) | 2021 (CAD) |
|---|---|---|---|
Canada | 268 k | 7,95 M | 22,05 M |
Coordonnées de la Société: Choom Holdings Inc.
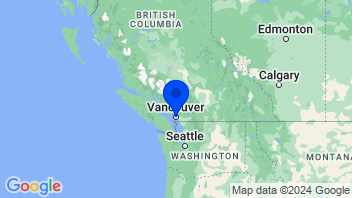
Choom Holdings, Inc.
1525 West 8th Avenue
V6J 1T5, Vancouver
+
Détaillants de produits à base de cannabis
Ajouter à une liste 0 sélectionné | Varia. | Varia. 5j. | Varia. 1an | Varia. 3ans | Capi.($) | |
|---|---|---|---|---|---|---|
 | -.--% | -.--% | - | - | 466 | |
| -0,60 % | +12,86 % | -27,73 % | +10,26 % | 17,6 Md | |
| +5,51 % | +11,38 % | -7,21 % | +15,46 % | 6,77 Md | |
| +4,32 % | +7,49 % | -3,20 % | +8,49 % | 6,66 Md | |
| -1,77 % | +7,79 % | -45,72 % | -38,24 % | 6,39 Md | |
| -6,46 % | -4,31 % | +6,93 % | -14,36 % | 4,91 Md | |
| -19,24 % | -2,63 % | -29,69 % | -42,17 % | 4,72 Md | |
| -4,42 % | +1,38 % | +12,30 % | -16,54 % | 3,66 Md | |
| +1,15 % | +1,27 % | -17,81 % | -30,27 % | 3,15 Md | |
| +1,03 % | +6,18 % | -10,03 % | -17,19 % | 3,17 Md | |
| Moyenne | -2,05 % | +2,57 % | -13,57 % | -13,84 % | 6 Md | |
| Moyenne pondérée par Capi. | -1,54 % | +5,64 % | -17,52 % | -6,71 % |

- Bourse
- Actions
- Action CHOOF
- Société Choom Holdings Inc.
🔇
Sélectionnez votre édition
Toutes les informations financières adaptées au niveau national


