








Description de l'Activité: Etalon Group PLC

Nombre d'employés: 6 636
Répartition des Ventes par Activité: Etalon Group PLC
| Période Fiscale: Décembre | 2021 (RUB) | 2022 (RUB) | 2023 (RUB) | 2024 (RUB) | 2025 (RUB) |
|---|---|---|---|---|---|
Residential Real Estate Property | 75,27 Md | 69,11 Md | 77,99 Md | 114 Md | - |
Contract Construction | 20,97 Md | 28,63 Md | 31,07 Md | 43,68 Md | - |
Other | 10,06 Md | 9,92 Md | 11,65 Md | 17,18 Md | - |
Inter-Segment Revenue | -19,17 Md | -27,11 Md | -31,92 Md | -43,72 Md | - |
Répartition Géographique des Ventes: Etalon Group PLC
| Période Fiscale: Décembre | 2021 (RUB) | 2022 (RUB) | 2023 (RUB) | 2024 (RUB) | 2025 (RUB) |
|---|---|---|---|---|---|
Russia | 87,14 Md | 80,56 Md | 88,79 Md | 131 Md | - |
Comité Exécutif: Etalon Group PLC
| Dirigeant | Titre | Age | Depuis |
|---|---|---|---|
| Directeur Général | 71 | 17/12/2018 | |
Ilya Kosolapov
DFI | Directeur Financier/CFO | - | 21/02/2020 |
Petr Kryuchkov
CIO | Directeur en chef des Investissements | - | 01/05/2020 |
Maria Bevzyuk
IRC | Investor Relations Contact | - | - |
Ivan Bogatov
PRN | Corporate Officer/Principal | - | - |
Composition du Conseil d'Administration: Etalon Group PLC
| Administrateur | Titre | Age | Depuis |
|---|---|---|---|
| Directeur/Membre du Conseil | 71 | 30/04/2021 | |
Sergey Egorov
CHM | Président | 44 | - |
Marina Ogloblina
BRD | Directeur/Membre du Conseil | - | 19/02/2019 |
| Directeur/Membre du Conseil | 70 | 30/04/2021 | |
Vitaly Pyltsov
BRD | Directeur/Membre du Conseil | 58 | 05/04/2022 |
Andreas Kryftis
BRD | Directeur/Membre du Conseil | - | 26/04/2023 |
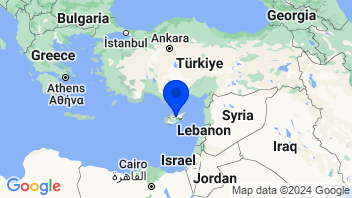
Coordonnées de la Société: Etalon Group PLC
Sociétés du Groupe: Etalon Group PLC
| Nom | Catégorie et Secteur |
|---|---|
Etalon Group Ltd. (Cyprus) | |
Etalon Development Ltd.
 Etalon Development Ltd. Miscellaneous Commercial ServicesCommercial Services Provides other business support services |
Miscellaneous Commercial Services
|
Constructeurs d'habitations - Maisons multifamiliales
Ajouter à une liste 0 sélectionné | Varia. | Varia. 5j. | Varia. 1an | Varia. 3ans | Capi.($) | |
|---|---|---|---|---|---|---|
 | +0,61 % | -2,10 % | +4,29 % | +12,75 % | 38,96 Md | |
| +0,37 % | -3,47 % | +10,15 % | +41,57 % | 22,93 Md | |
| +0,69 % | -3,96 % | -28,51 % | -34,97 % | 19,52 Md | |
| +1,02 % | -0,40 % | -8,59 % | +12,30 % | 18,45 Md | |
| -0,11 % | -4,53 % | -21,25 % | -10,63 % | 14,91 Md | |
| -0,31 % | -0,67 % | +6,88 % | +17,18 % | 14,57 Md | |
| +1,30 % | -3,53 % | +15,26 % | +69,80 % | 13,25 Md | |
| -0,08 % | -2,33 % | +4,55 % | +24,69 % | 6,69 Md | |
| +0,01 % | -.--% | -.--% | -.--% | 6,31 Md | |
| Moyenne | +0,39 % | -1,44 % | -1,91 % | +14,74 % | 17 Md | |
| Moyenne pondérée par Capi. | +0,48 % | -2,21 % | -1,92 % | +13,99 % |


