








Société Tryggingamiðstöðin Nasdaq Iceland
Actions
TM
IS0000000586
Services de banque d'investissement et de courtage
Description de l'Activité: Tryggingamiðstöðin

Répartition des Ventes par Activité: Tryggingamiðstöðin
| Période Fiscale: Décembre | 2021 (ISK) | 2022 (ISK) | 2023 (ISK) | 2024 (ISK) | 2025 (ISK) |
|---|---|---|---|---|---|
Commercial Banking | 5,55 Md | 6,7 Md | 4,72 Md | 5,51 Md | 6,49 Md |
Investment Banking (Excluding UK Operations) | - | 3,03 Md | 5,21 Md | 5,71 Md | 4,32 Md |
UK Operations | - | 955 M | 1,2 Md | 2,76 Md | 3,77 Md |
Asset Management | 3,79 Md | 3,14 Md | 2,61 Md | 2,59 Md | 2,35 Md |
Treasury | - | - | - | - | 1,96 Md |
Supporting Units | 62,38 M | 51,72 M | 53,18 M | -34,04 M | -29 M |
Investment Banking | 4,86 Md | - | - | - | - |
Insurance | 7,91 Md | 4,74 Md | - | - | - |
Répartition Géographique des Ventes: Tryggingamiðstöðin
| Période Fiscale: Décembre | 2021 (ISK) | 2022 (ISK) | 2023 (ISK) | 2024 (ISK) | 2025 (ISK) |
|---|---|---|---|---|---|
Iceland | - | 18,13 Md | 13,44 Md | 14,26 Md | 15,57 Md |
UK | - | 1,05 Md | 1,41 Md | 2,92 Md | 3,84 Md |
Comité Exécutif: Tryggingamiðstöðin
| Dirigeant | Titre | Age | Depuis |
|---|---|---|---|
| Directeur Général | - | 01/06/2017 | |
| Directeur Financier/CFO | - | 01/12/2022 | |
Bjarni Eyvindur
CIO | Directeur en chef des Investissements | - | - |
| Compliance Officer | - | - | |
| Directeur des opérations | - | 07/04/2022 |
Composition du Conseil d'Administration: Tryggingamiðstöðin
| Administrateur | Titre | Age | Depuis |
|---|---|---|---|
Guðjón Reynisson
BRD | Directeur/Membre du Conseil | 63 | 01/04/2018 |
| Directeur/Membre du Conseil | 46 | 01/04/2021 | |
| Directeur/Membre du Conseil | 50 | 01/09/2021 | |
| Président | 46 | 01/03/2020 | |
Páll Harðarson
BRD | Directeur/Membre du Conseil | 60 | 01/03/2025 |
Participations: Tryggingamiðstöðin
| Nom | Actions | % | Valorisation |
|---|---|---|---|
AMAROQ LTD. 2,65 % | 12 354 458 | 2,65 % | 16 M $ |
KVIKA BANKI HF. 2,87 % | 124 306 459 | 2,87 % | 14 M $ |
NOVA KLÚBBURINN HF. 5,36 % | 184 936 182 | 5,36 % | 5 M $ |
| 63 838 722 | 2,08 % | 2 M $ |
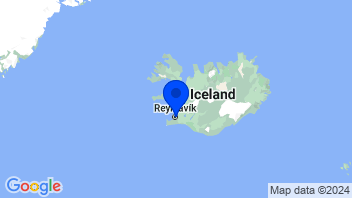
Coordonnées de la Société: Tryggingamiðstöðin
Sociétés du Groupe: Tryggingamiðstöðin
| Nom | Catégorie et Secteur |
|---|---|
Kvika eignastýring hf.
 Kvika eignastýring hf. Investment ManagersFinance Kvika eignastýring invests domestically as well as in foreign markets. The firm offers products covering all major asset classes, including fixed-income securities, equities and private equity in both domestic and international markets. |
Investment Managers
|
GAMMA Capital Management hf
 GAMMA Capital Management hf Investment ManagersFinance Profile Unavailable. |
Investment Managers
|
straumur greiðslumiðlun hf. | |
Kvika Securities Ltd.
 Kvika Securities Ltd. Investment ManagersFinance Kvika invests in lower mid-market companies located in the United Kingdom with an EBITDA of GBP 1- 10 million. The firm focuses on companies operating across a broad range of sectors and industries. It provides financing in the form of debt and equity in buyout transactions with an investment size of GBP 5 - 30 million. The firm also acquires minority and majority stakes. |
Investment Managers
|
Kvika Advisory Ltd.
 Kvika Advisory Ltd. Investment ManagersFinance Provides advisory services in acquisitions, divestments, mergers, financing and restructuring |
Investment Managers
|
Banque d'investissement
Ajouter à une liste 0 sélectionné | Varia. | Varia. 5j. | Varia. 1an | Varia. 3ans | Capi.($) | |
|---|---|---|---|---|---|---|
 | +0,78 % | +5,08 % | +16,35 % | +143,46 % | 298 Md | |
| +0,32 % | +5,86 % | +15,89 % | +170,60 % | 275 Md | |
| -0,04 % | +4,17 % | +23,64 % | +179,55 % | 205 Md | |
| +1,73 % | +1,63 % | -1,49 % | +69,70 % | 160 Md | |
| -0,32 % | -2,80 % | -12,71 % | +10,52 % | 54,68 Md | |
| -0,26 % | -2,74 % | +1,14 % | +58,22 % | 46,09 Md | |
| +0,33 % | -2,61 % | -25,47 % | +17,62 % | 43,35 Md | |
| +0,50 % | -2,31 % | -18,54 % | +5,44 % | 39,33 Md | |
| +0,57 % | +7,87 % | +23,87 % | +310,85 % | 37,06 Md | |
| Moyenne | +0,40 % | +1,62 % | +2,52 % | +107,33 % | 129 Md | |
| Moyenne pondérée par Capi. | +0,53 % | +3,37 % | +10,58 % | +132,38 % |


